The Economics of Urban Parking
Conventional Garages, Surface Lots, Underground Structures, and the Multi-Million-Dollar Case for Going Vertical with Car Stackers & Puzzle Parking Lifts by TheAutomatedParkingCompany.com (877) 827-2611
Executive Summary
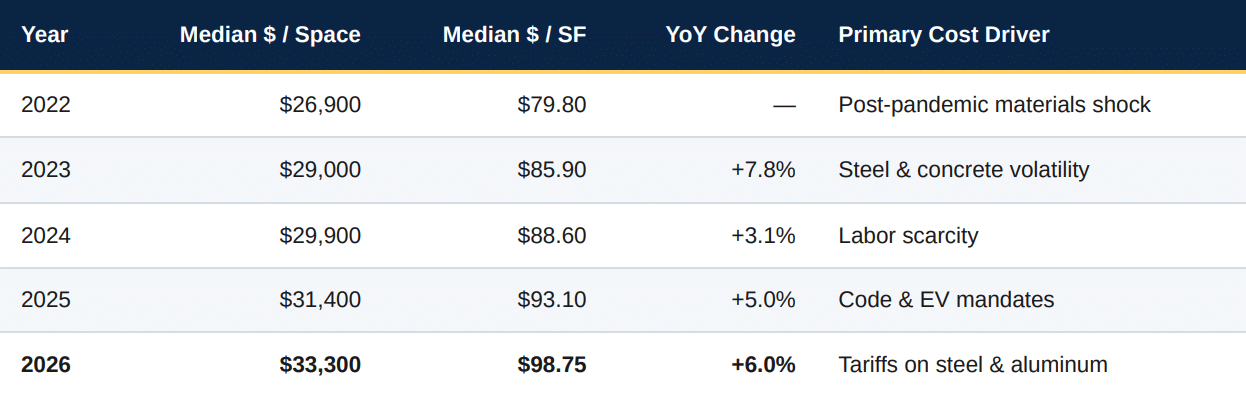
Parking, long treated as an accessory to the buildings it serves, has become one of the single most decisive line items in urban real estate. In 2026, the national median hard construction cost for a conventional above-grade parking structure in the United States reached $33,300 per space, according to the 20th annual WGI Parking Structure Cost Outlook — a 6% increase over 2025 and roughly 11% above 2024 estimates that many pro formas still carry (WGI, 2026).
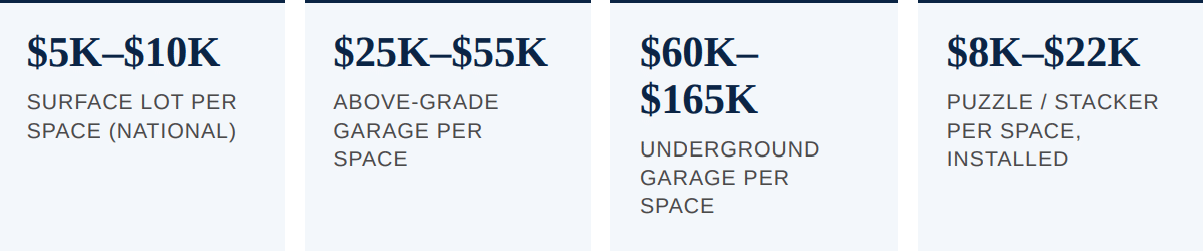
Underground parking now averages roughly $60,000 to $120,000 per space and can exceed $165,000 per space at four levels below grade. Surface lots, though cheapest to build at $5,000 to $10,000 per space, consume 320 to 400 square feet of land per stall — a land tax that on any parcel worth more than a few hundred thousand dollars per acre eclipses the entire construction cost of a garage.
This white paper synthesizes 2025–2026 industry cost data from WGI, RSMeans, the International Parking & Mobility Institute (IPMI), the UCLA Institute of Transportation Studies, Rider Levett Bucknall, Terrapin Consulting Group, and multiple automated-parking manufacturers, and applies it to every U.S. metropolitan statistical area with a population over one million — a group of 56 metros representing roughly 60% of the American population — plus a selection of global comparator cities.
The central finding is unambiguous: on any site where land is worth more than roughly $1.5 million per acre — a threshold now crossed in virtually every U.S. metro over one million residents — a vertical mechanical parking solution (car stacker or puzzle parking lift) will deliver a lower per-space delivered cost, a smaller building footprint, and a materially better 30-year total cost of ownership than a conventional above-grade or underground garage. In the highest-cost markets (San Francisco, Manhattan, Boston, Los Angeles), the swing exceeds $8 million to $27 million over a 30-year hold on a 60-space facility once foregone rental revenue on reclaimed land is included (The Automated Parking Company, 2026).
KEY TAKEAWAYS
Construction cost gap: A conventional urban parking space costs $25,000–$120,000 to build; a puzzle parking or car-stacker space costs $8,000–$22,000 fully installed.
Land efficiency: Puzzle systems deliver 2× to 4× the parking capacity in the same footprint as a conventional garage, freeing thousands of square feet for revenue-generating uses.
Speed of delivery: Car stackers and puzzle systems install in weeks to months rather than the 9–14 months a mid-sized conventional structure requires.
Operating cost: Reduced ventilation, lighting, and staffing can save $2,000+ per month per facility, or $720,000+ over a 30-year hold.
A free online estimator — the TAP Calculator — allows any owner, architect, or municipal planner to model these savings for their own city and project in under five minutes.
The remainder of this paper walks through the underlying data city by city, quantifies the land opportunity cost that most pro formas ignore, presents a full 30-year total-cost-of-ownership comparison, and offers policy recommendations for municipalities seeking to unlock housing supply without abandoning legitimate parking demand.
Executive Summary 4 1. Introduction: Why Parking Economics Now Decides Project Feasibility 6 2. Baseline Cost Benchmarks by Parking Typology (2026) 8 2.1 Surface / Flat Parking Lots 8 2.2 Above-Grade Conventional Parking Garages 9 2.3 Below-Grade / Underground Parking Structures 9 2.4 Mechanical, Stacker, and Puzzle Systems 10 3. Metropolitan Cost Analysis: Cities Over One Million 12 3.1 United States Metropolitan Statistical Areas 12 3.2 Focus Cities: Boston, LA, SF, San Diego, NYC, Chicago, Miami, D.C. 15 3.3 Global Comparison: World Metros Over One Million 17 4. The Hidden Land Equation: Opportunity Cost of Every Stall 19 5. Vertical Alternatives: Car Stackers & Puzzle Parking Lifts 21 6. Total Cost of Ownership: A 30-Year Comparative Model 23 7. Case Studies & Real-World Savings 25 8. The Free Online Calculator: How to Use TAP Calculator 27 9. Policy, Zoning, and Municipal Considerations 29 10. Recommendations for CRE Investors, Architects, and Municipalities 31 11. Conclusion 33 References & Data Sources 34
1. Introduction: Why Parking Economics Now Decides Project Feasibility
For most of the twentieth century, parking was treated by developers as a minor engineering item — a bolt-on to the “real” building above or beside it. That framing survived because parking was, in real terms, cheap. Land was abundant on the urban fringe, minimum-parking mandates were absorbed into every pro forma without protest, and concrete decks priced at a fraction of what they do today. Between 2020 and 2026, that arithmetic broke.
The WGI Parking Structure Cost Outlook — the most widely referenced U.S. benchmark for parking-facility hard costs — has tracked a compounding escalation curve that no other commercial building typology has quite matched over the same window:
Table 1.1 — National median hard-cost per space, above-grade U.S. parking structures
Source: WGI Parking Structure Cost Outlook, 2022–2026 editions. Figures reflect hard construction cost only, excluding land, soft costs,
financing, and below-grade or under-building projects.
An owner working from a 2024 estimate is now roughly 11% underwater on the median before any project specific risk. And “hard construction cost only” is exactly what the number says: WGI’s figures explicitly exclude the 15% to 25% soft-cost load that developers actually carry — architectural and engineering fees, geotechnical work, permitting, environmental review, financing, legal, and administrative expenses (WGI, 2026). Add land at even the most modest urban rates and the fully-loaded cost of a delivered urban parking space in a top-10 U.S. metro comfortably clears $45,000 to $60,000 above grade and $85,000 to $175,000 underground.
Simultaneously, the UCLA Institute of Transportation Studies published its February 2026 analysis, No Such Thing as Free Parking: Construction Costs in 17 U.S. Cities, which reached a starker conclusion still: minimum parking requirements now add $50,000 to $100,000 per housing unit in dense markets, and in some cities push total project construction cost up by more than 50% (Schwartz, 2026). Parking, in other words, has become the tail that wags the housing-affordability dog.
For the audiences of this paper — CRE investors underwriting yield, architects sizing structural systems, and municipal officials calibrating zoning — three implications follow:
Every parking decision is now a capital-allocation decision on the same scale as the rest of the building. A 400-space garage on a $50 million project is a $10–$19 million line item; a 10% swing on that scope is a quarter-million-dollar conversation.
The right parking typology depends far more on land value than on parking demand. The same 300 required stalls can be delivered in ways that vary by an order of magnitude in delivered cost, land consumption, revenue displacement, and 30-year operating burden.
A cheaper, faster, denser alternative already exists — semi-automated and fully automated puzzle parking lifts and car stackers — that most U.S. pro formas still fail to model, largely because the reference cost data historically has not been aggregated into a single accessible tool. The TAPCalculator introduced later in this paper is designed to close that gap.
The chapters that follow provide the benchmark data, the metropolitan matrix, the total-cost-of-ownership math, and the policy framing needed to make this decision defensibly.
2. Baseline Cost Benchmarks by Parking Typology (2026)
Before any city-level or project-level analysis is credible, the underlying per-space cost bands must be established for each of the four dominant parking typologies used in U.S. and international practice. The figures be low reflect fully-loaded 2026 hard construction cost per space, drawn from WGI (2026), RSMeans 2026 data, Terrapin Consulting Group project databases, the IPMI 2025 Cost Survey, UCLA / Rider Levett Bucknall (2026), and manufacturer pricing from Robotic Parking Systems, ParkPlus, The Automated Parking Company, Solid Parking, and comparable vendors.
2.1 Surface (Flat) Parking Lots
Surface parking remains the cheapest form of vehicle storage per unit of construction cost — but the most expensive per unit of land. A modern paved, striped, ADA-compliant, and lit surface stall in 2026 runs approximately $4,500 to $9,500 per space, with the upper end reflecting technology-integrated lots that include LED lighting, license plate recognition (LPR) cameras, mobile payment kiosks, EV-ready conduit, and stormwater detention (Wins Parking, 2026; Terrapin Consulting Group, 2026). The five cost drivers that account for roughly 80% of variance are:
Site preparation and grading — clearing, cut/fill, soil stabilization.
Drainage and stormwater compliance — detention, filtration, engineered piping
Paving section — thickness, asphalt vs. concrete
Electrical infrastructure — lighting, LPR, EV charging
Regional labor and material indices — up to ±25% swing on identical scope
The economics of surface parking, however, collapse under any meaningful land value. A standard surface space consumes approximately 320 to 400 gross square feet including drive aisles, which at land prices of $1 million per acre translates to roughly $7,500 to $9,200 of land per space — before any construction. In the top-tier U.S. metros, where urban land now commonly transacts at $3 million to $50+ million per acre, the land component alone can dwarf the entire construction cost of a fully structured garage.
2.2 Above-Grade Conventional Parking Garages
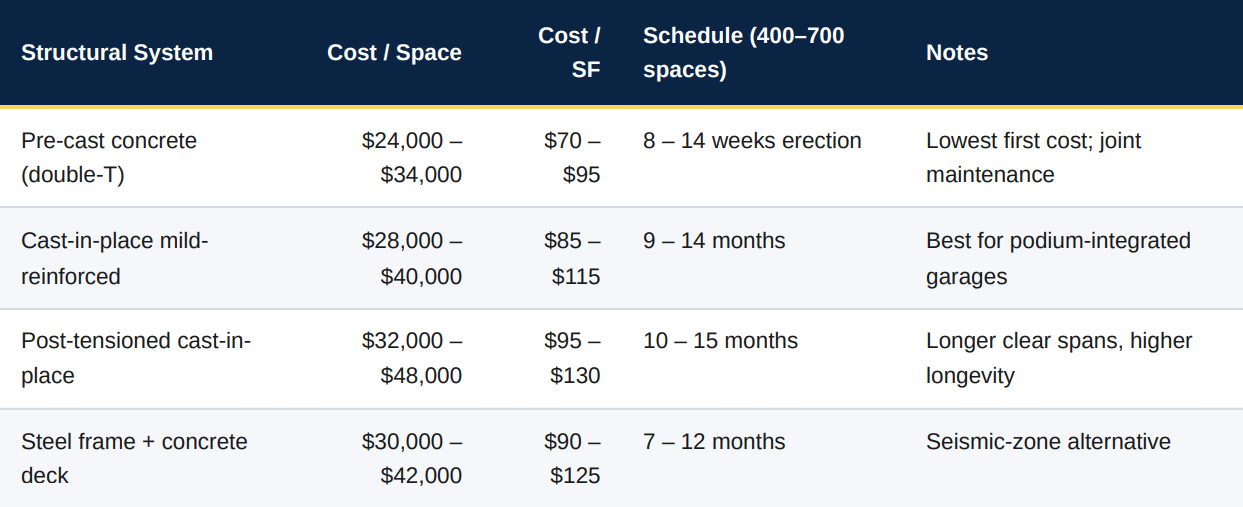
Above-grade structured parking is the workhorse typology across the United States. WGI’s 2026 national median of $33,300 per space and $98.75 per square foot anchors the market, but the real spread across structural systems and regions is significant (WGI, 2026; Terrapin Consulting Group, 2026):
Table 2.1 — Above-grade parking garage cost per space by structural system (2026)
Layout efficiency further compounds cost variance. A garage designed at 320 gross square feet per space delivers 313 stalls on 100,000 SF; the same footprint at 380 SF per space delivers only 263 stalls — a 50-space difference worth approximately $1.6 million at $32,000 per space (Terrapin Consulting Group, 2026). Specialist parking-design firms routinely recover their entire design fee by squeezing 8% to 18% more spaces out of the same footprint than a generalist team would.
2.3 Below-Grade (Underground) Parking Structures
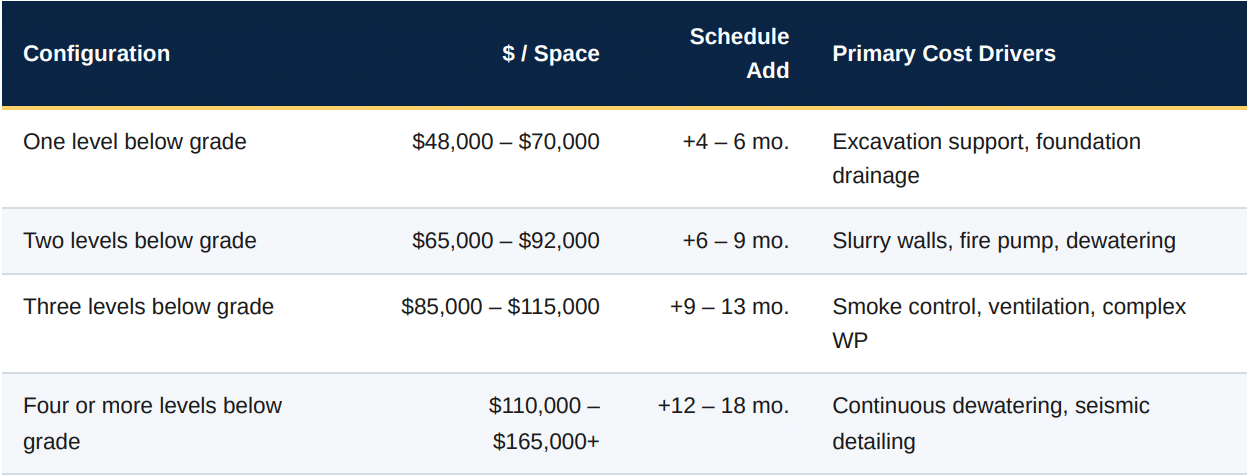
Underground parking is the most capital-intensive form of vehicle storage in common use. Each level below grade adds excavation support, hydrostatic waterproofing, mechanical ventilation engineered for CO/CO₂ dispersal, multi-stage life-safety egress, and — on any site with seasonal high water — permanent dewatering systems that carry perpetual operating cost (Terrapin Consulting Group, 2026):
Table 2.2 — Below-grade parking cost curve by depth (2026)
The industry rule of thumb — one level down doubles per-space cost, two levels down triples it — remains empirically accurate in 2026. Underground parking is justified in only two conditions: (1) land value so extreme that the surface footprint must be reserved for other uses, and (2) municipal or design constraints that prohibit above-grade visual presence. Both conditions are precisely the circumstances in which mechanical vertical alternatives (Chapter 5) will most decisively outperform.
2.4 Mechanical, Stacker, and Puzzle Parking Systems
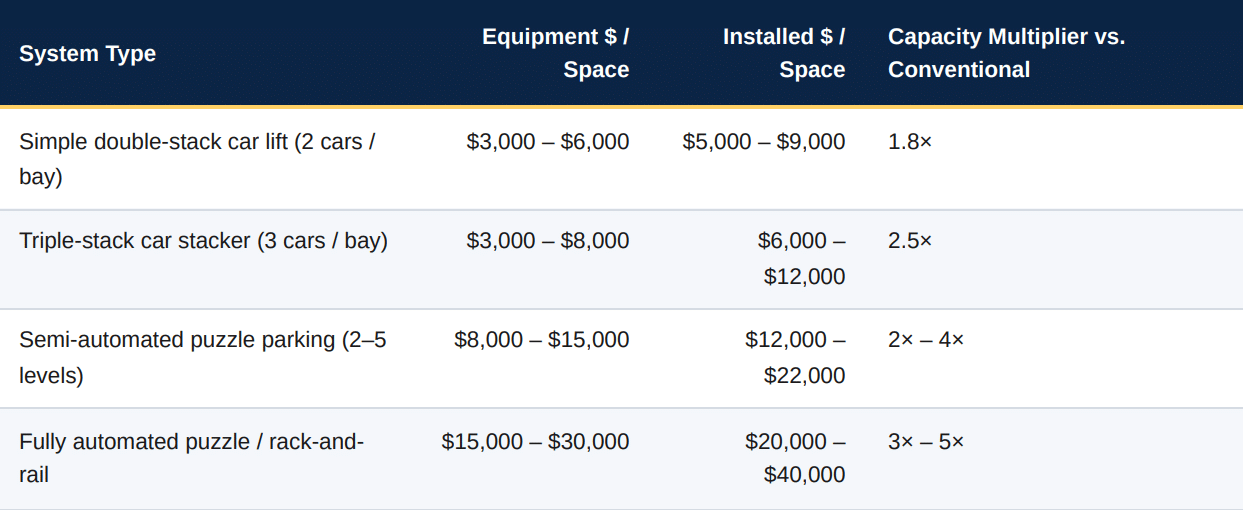
Mechanical parking systems have quietly matured from a Japanese and European specialty into a viable — often superior — alternative for U.S. urban infill projects. The category encompasses several distinct technologies at different price points:
Table 2.3 — Mechanical / vertical parking systems, cost per space (2026, U.S. installed)
Sources: The Automated Parking Company (2026); Robotic Parking Systems (2025); ParkPlus (2025); Solid Parking (2025); Mutrade (2025).
The key insight is not the equipment price — which for the semi-automated puzzle systems most relevant to U.S. mid-scale projects is competitive with or lower than a conventional pre-cast garage on a per-space basis —but the land multiplier. A semi-automated puzzle parking system can create up to 114 parking spaces in approximately 4,000 square feet of floor area (The Automated Parking Company, 2026). The same 114 spaces in a conventional above-grade garage would require roughly 36,500 to 43,300 square feet of gross deck area — a difference of approximately 32,500 to 39,300 square feet of building or land that a puzzle system frees for other uses.
THE REAL COMPARISON
Per-space equipment cost is the wrong benchmark on which to reject mechanical parking. The correct benchmark is delivered cost per space plus opportunity cost of land consumed. On this basis, puzzle and stacker systems win in every U.S. metro over one million population — often by seven or eight figures over the hold period.
3. Metropolitan Cost Analysis: Cities Over One Million
The national median is a useful anchor but a dangerous planning tool. Regional cost multipliers, driven by construction labor rates, structural material logistics, seismic and code requirements, land price, and competing demand from other mega-projects (data centers, industrial, mixed-use towers), can swing an identical parking garage scope by ±25% to ±45% across U.S. markets. This chapter presents 2026 cost benchmarks for every U.S. metropolitan statistical area with a population over one million, followed by a deeper analysis of the eight focus cities identified in this paper’s scope.
3.1 United States Metropolitan Statistical Areas Over One Million
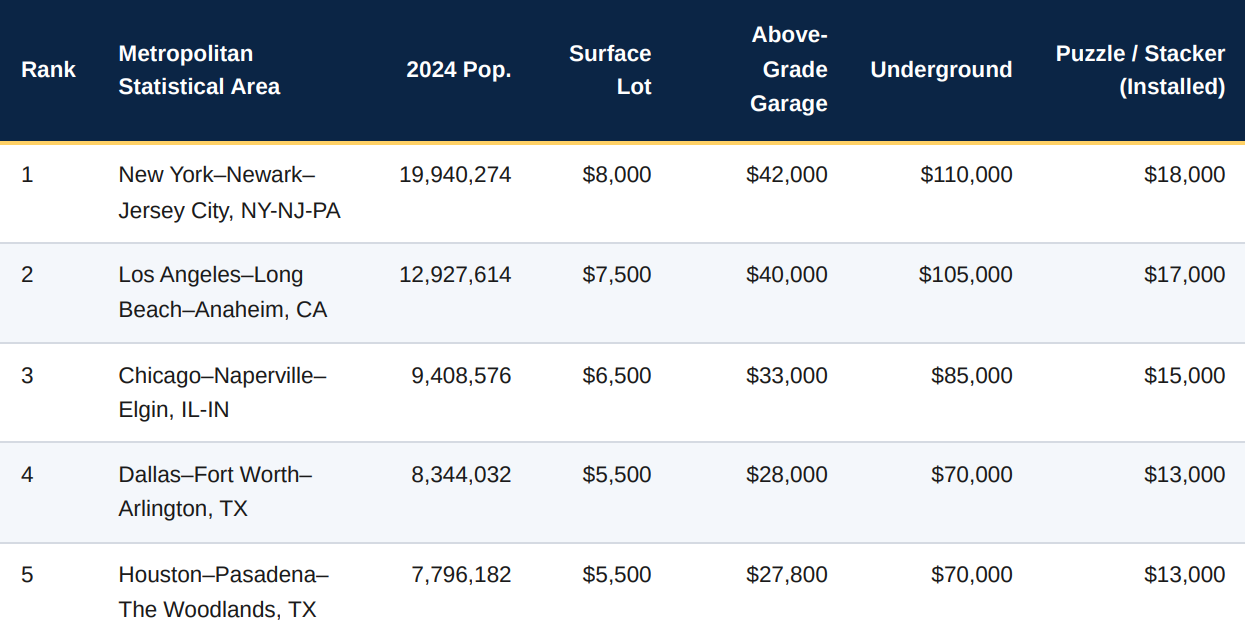
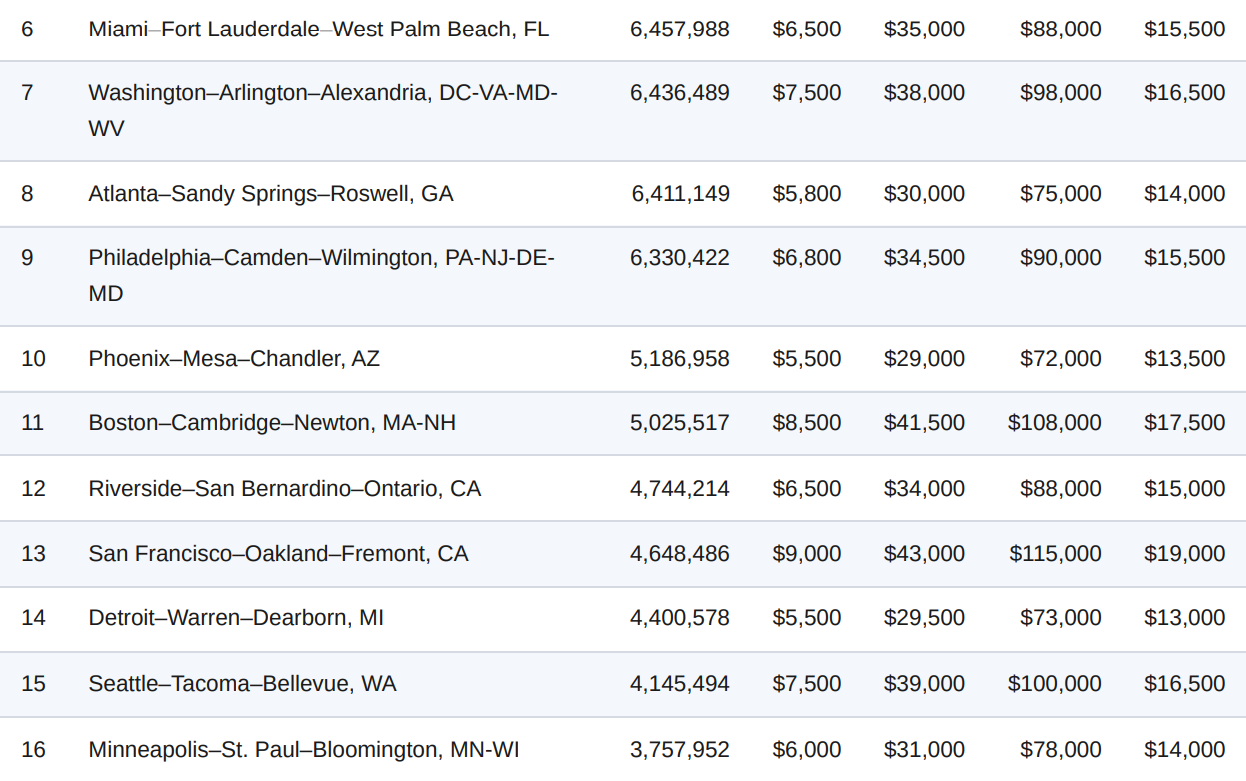
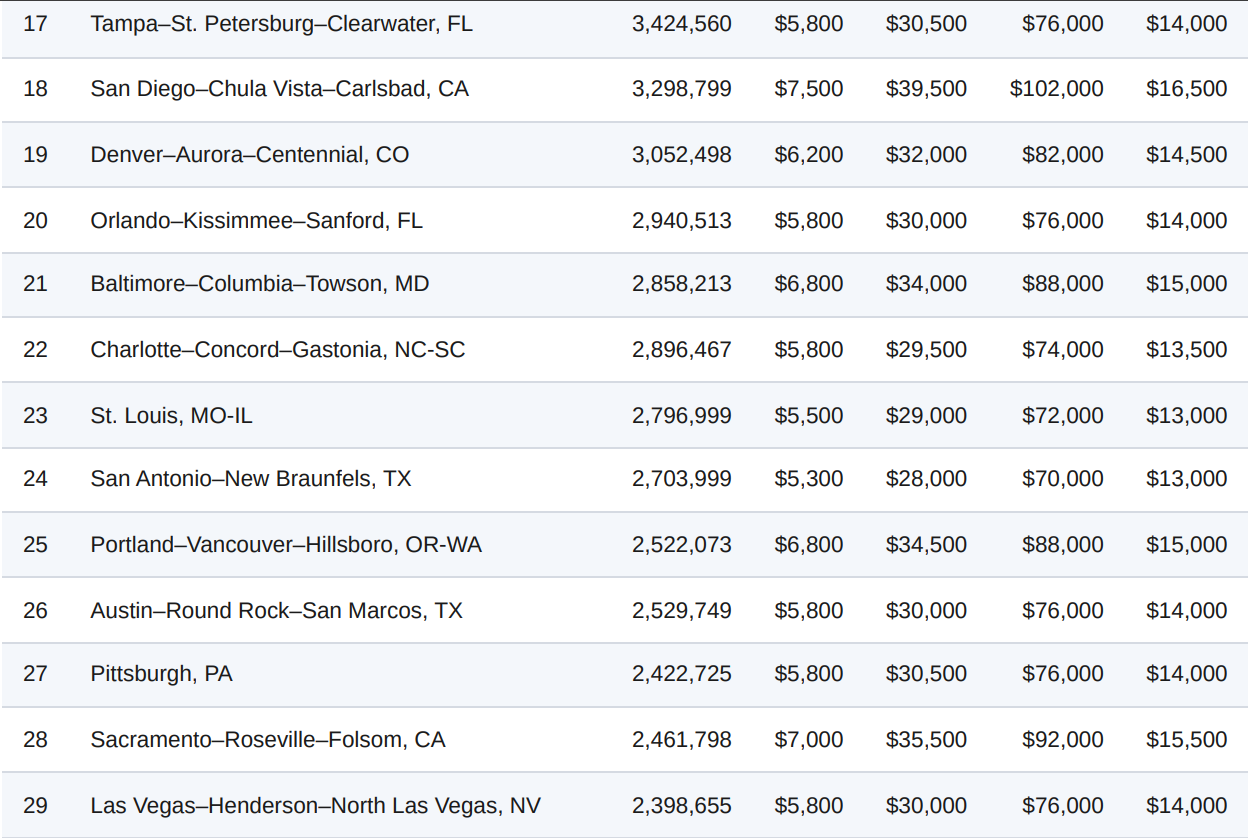
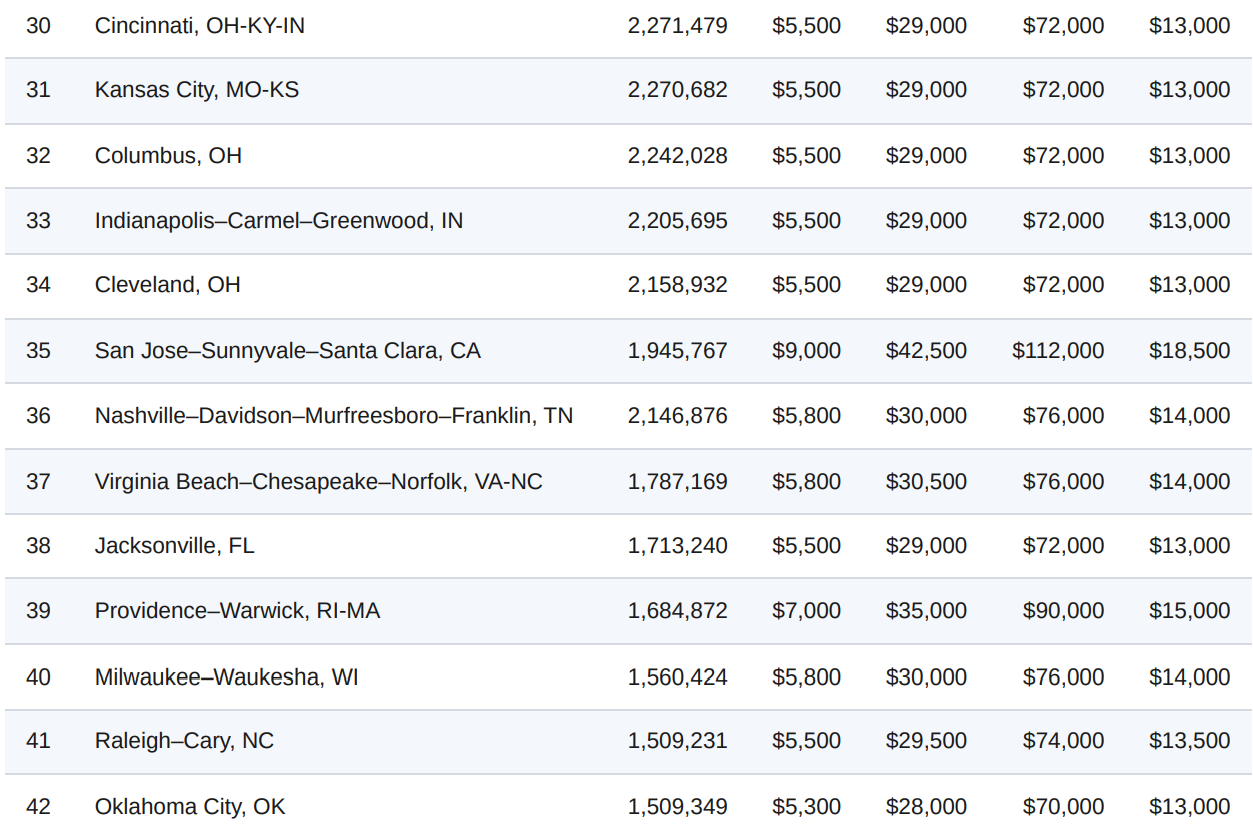
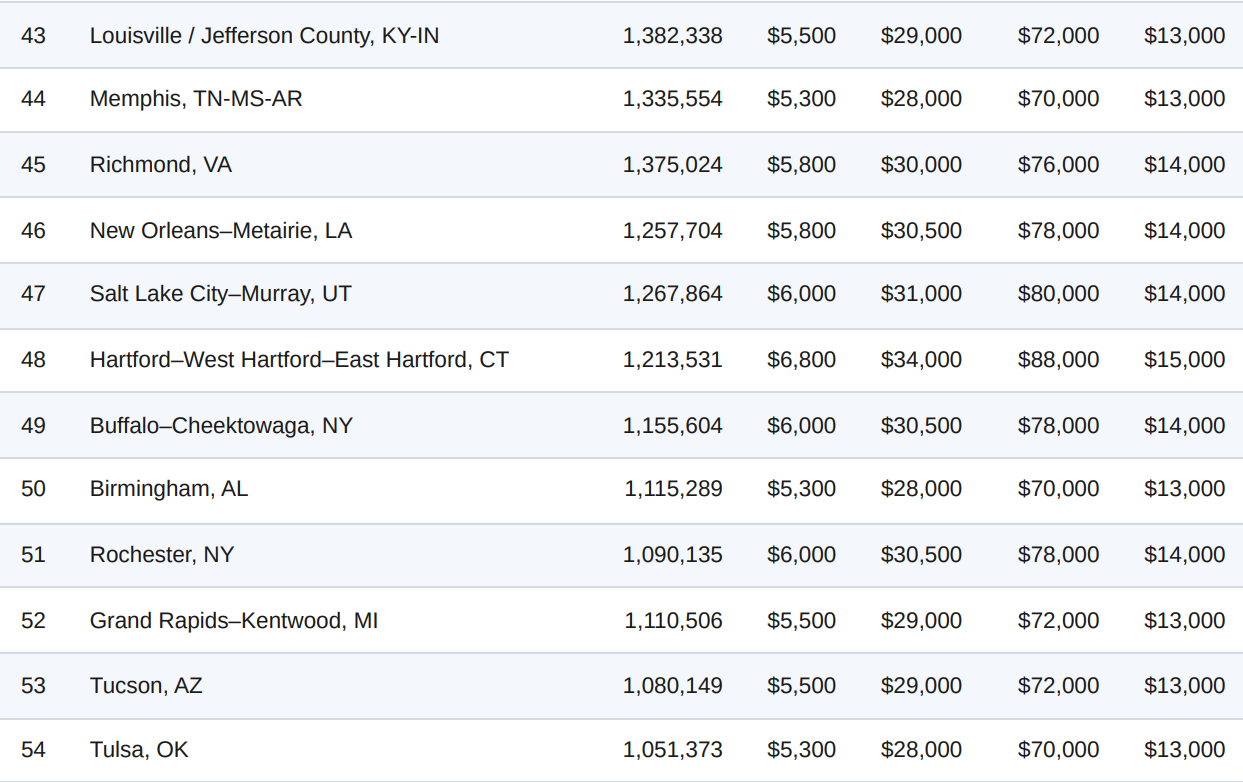
The U.S. Census Bureau’s 2024 estimates identify 56 Metropolitan Statistical Areas (MSAs) with a population exceeding one million (U.S. Census Bureau, 2025). The table below combines those population figures with 2026 per-space construction cost estimates for each major parking typology, derived from WGI (2026) regional bands, RSMeans 2026 city-index data, UCLA / Rider Levett Bucknall’s 17-city analysis (Schwartz, 2026), and Terrapin Consulting Group’s 2026 regional benchmarks. All cost figures are hard construction only, per space.
Table 3.1 — U.S. Metropolitan Statistical Areas over 1,000,000 population, with 2026 per-space parking construction cost (hard cost only)
Sources: 2024 population estimates from U.S. Census Bureau, released March 13, 2025. Cost figures synthesized from WGI (2026), RSMeans 2026, UCLA / Rider Levett Bucknall (Schwartz, 2026), Terrapin Consulting Group (2026), and industry vendor pricing. Ranges shown as midpoints. Actual project pricing depends on structural system, site conditions, and design specifics — model your project with the TAP Calculator.
3.2 Focus Cities: A Closer Look
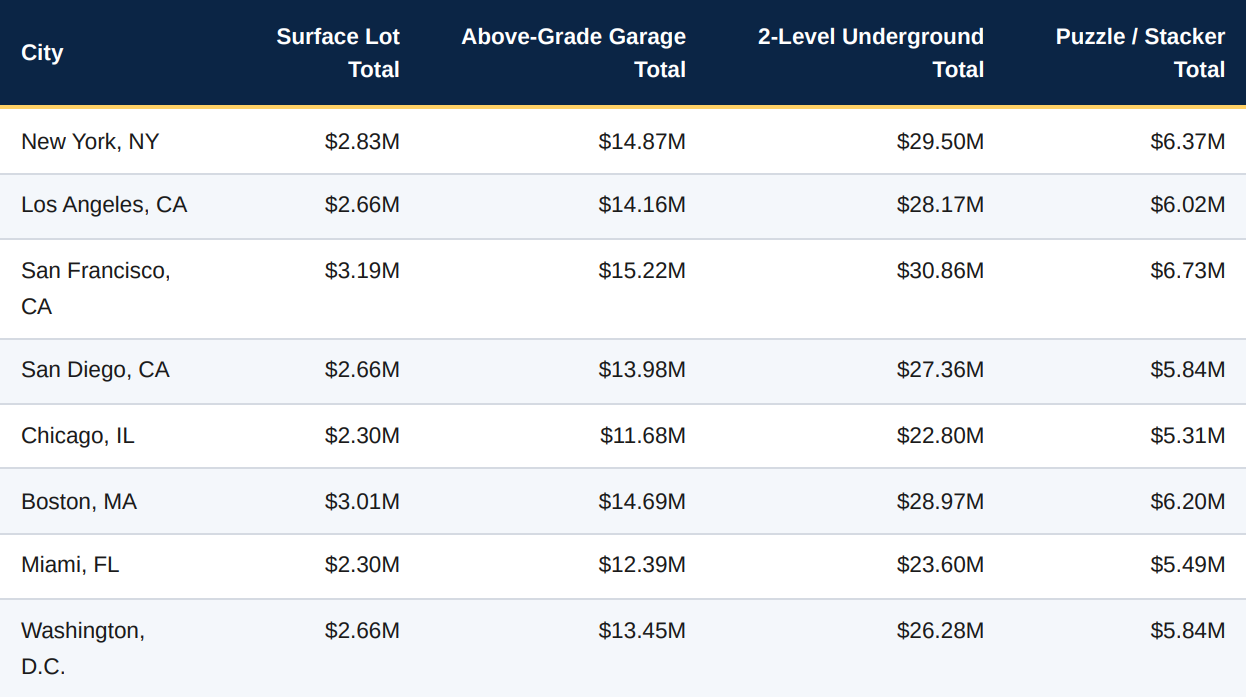
The eight focus cities identified in this paper’s scope — Boston, Los Angeles, San Francisco, San Diego, New York, Chicago, Miami, and Washington, D.C. — represent a cross-section of the highest-cost, highest-density parking markets in the United States. Table 3.2 provides the fully-loaded delivered-cost comparison for a representative 300-space facility in each market, including soft costs (assumed 18% of hard cost) but excluding land.
The per-project spread is stark: in San Francisco, choosing a 2-level underground garage over a semi-automated puzzle system for the same 300-space demand costs an additional $24.13 million in construction alone — a delta larger than the total construction budget of most mid-sized apartment buildings. Even against the cheapest structured alternative (an above-grade pre-cast garage), the puzzle system still comes in $8.5 million cheaper, before any land savings are counted.
FOCUS CITY SNAPSHOT: BOSTON
Boston’s construction market is among the most expensive in the country, driven by union labor rates, complex geotechnical conditions in the fill-based Back Bay and Seaport districts, and stringent stormwater and coastal resilience requirements. Above-grade pre-cast garages routinely price between $38,000 and $46,000 per space; underground work commonly exceeds $115,000 per space once dewatering, waterproofing, and multistage life-safety systems are included. A puzzle parking system, at ~$17,500 installed per space, cuts hard construction cost by 55% to 85% compared with conventional structured alternatives.
FOCUS CITY SNAPSHOT: SAN FRANCISCO & LOS ANGELES
The West Coast band carries a distinct +30% to +45% seismic and code premium over the Sunbelt (Irecruit /Terrapin Consulting Group, 2026). San Francisco tops WGI’s 2026 city rankings at $43,000 per space and $126.40 per SF for above-grade structures (WGI, 2026). Los Angeles follows closely, with the added complication of extremely fragmented parcels that favor smaller-footprint mechanical solutions over sprawling above-grade decks. In both markets, dependent car stackers have been used successfully to double parking capacity in existing garages without any structural expansion.
FOCUS CITY SNAPSHOT: NEW YORK CITY
Manhattan represents the extreme end of every parking cost driver: land routinely trades above $10 million per acre, union labor is the most expensive in the country, and below-grade parking beneath high-rise developments frequently exceeds $150,000 per space. Automated and puzzle systems have been operating in NYC since the mid-2000s (notably at 200 Eleventh Avenue), and the city’s Department of Buildings has established clear code paths for their approval. The economic case is overwhelming; the adoption barrier is institutional inertia.
FOCUS CITY SNAPSHOT: MIAMI & WASHINGTON, D.C.
Miami’s high water table makes below-grade parking exceptionally expensive — dewatering is often a permanent operating expense —pushing many projects toward above-grade or podium configurations. D.C.’s federal height limits similarly constrain vertical build-up and drive parking underground on many downtown sites. Both markets are ideal candidates for puzzle systems: they solve the exact constraint (density in limited footprint) that drives their high underground costs.
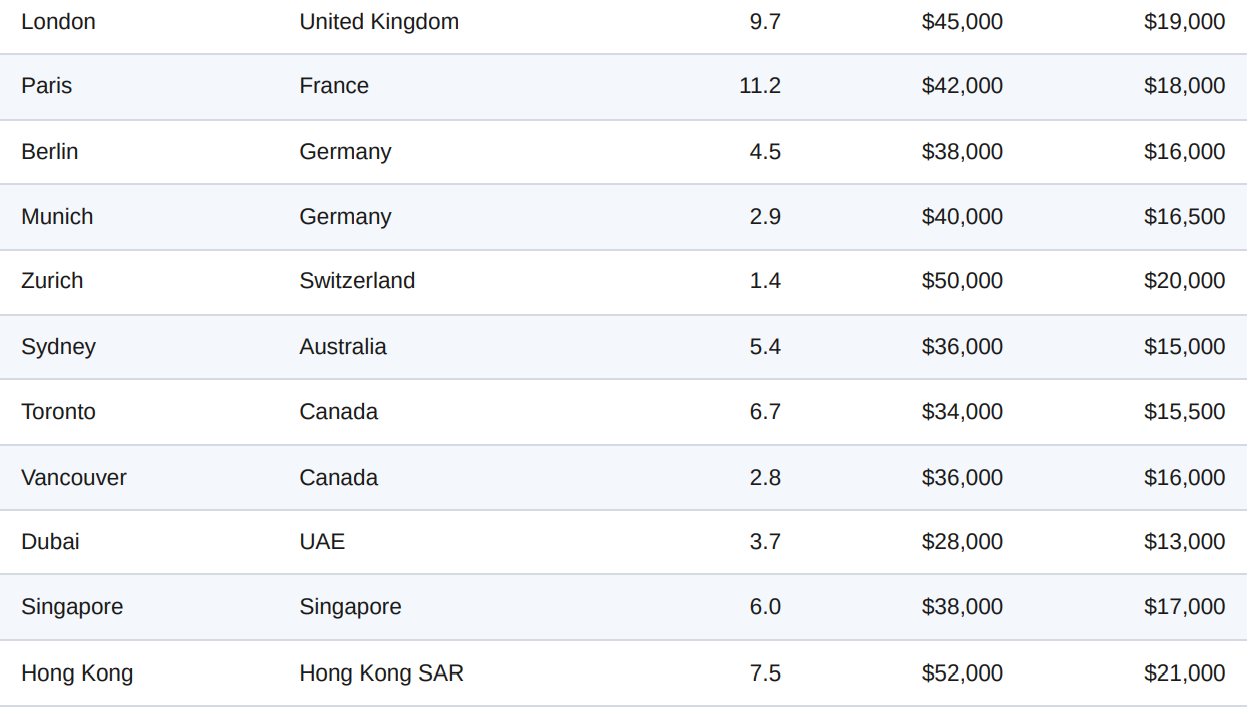
3.3 Global Comparison: Selected World Metros Over One Million
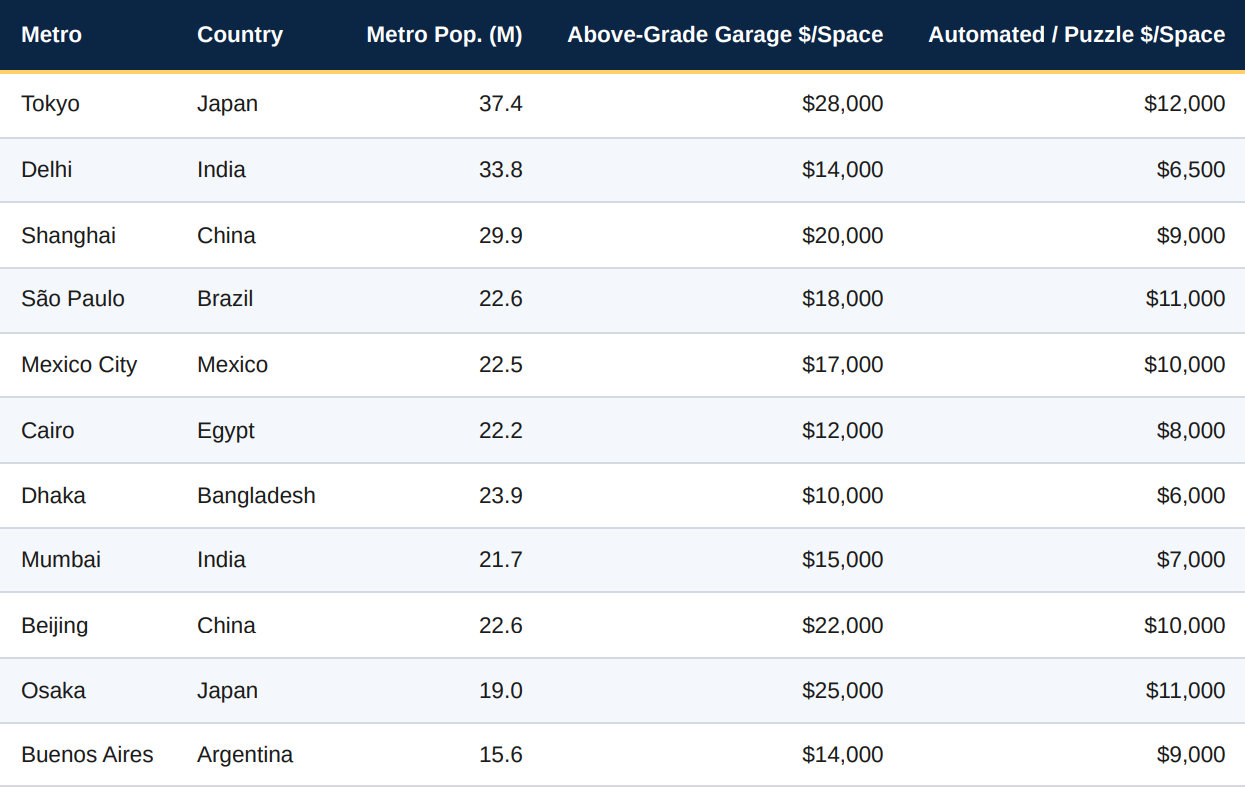
While U.S. developers often assume mechanical parking is a niche technology, in most of the world it is standard practice. Table 3.3 provides directional cost data for representative global metros, illustrating both the maturity of the technology outside the U.S. and the cost advantage that comes with widespread deployment.
Table 3.3 — Selected global metropolitan areas over 1M with representative parking cost benchmarks (USD, 2026)
Sources: Metro populations from UN World Cities in 2025 Data Booklet, World Population Review 2026, and Demographia. Cost benchmarks derived from published vendor pricing (Sanpark, Utron, ParkPlus, Robotic Parking Systems), local trade press, and cross referenced with WGI 2026 for U.S. comparators. Figures are directional planning benchmarks in USD.
The global data reveals that mechanical parking is not a speculative technology but a mature category with tens of thousands of installations worldwide. In Japan and South Korea, automated parking towers are standard urban infrastructure; in Germany, puzzle systems are commonly used for both residential and mixed-use projects. The U.S. market is roughly 15 to 20 years behind on adoption — a lag that creates opportunity for the CRE investors and municipalities willing to move first.
4. The Hidden Land Equation: Opportunity Cost of Every Stall
Every parking analysis that stops at construction cost misses the most important number in the model. Land is not free — even when the developer already owns it — because the land consumed by parking cannot be simultaneously used for anything else that would generate cash flow. The correct framework for parking economics is construction cost plus land cost plus foregone revenue on that land over the hold period.
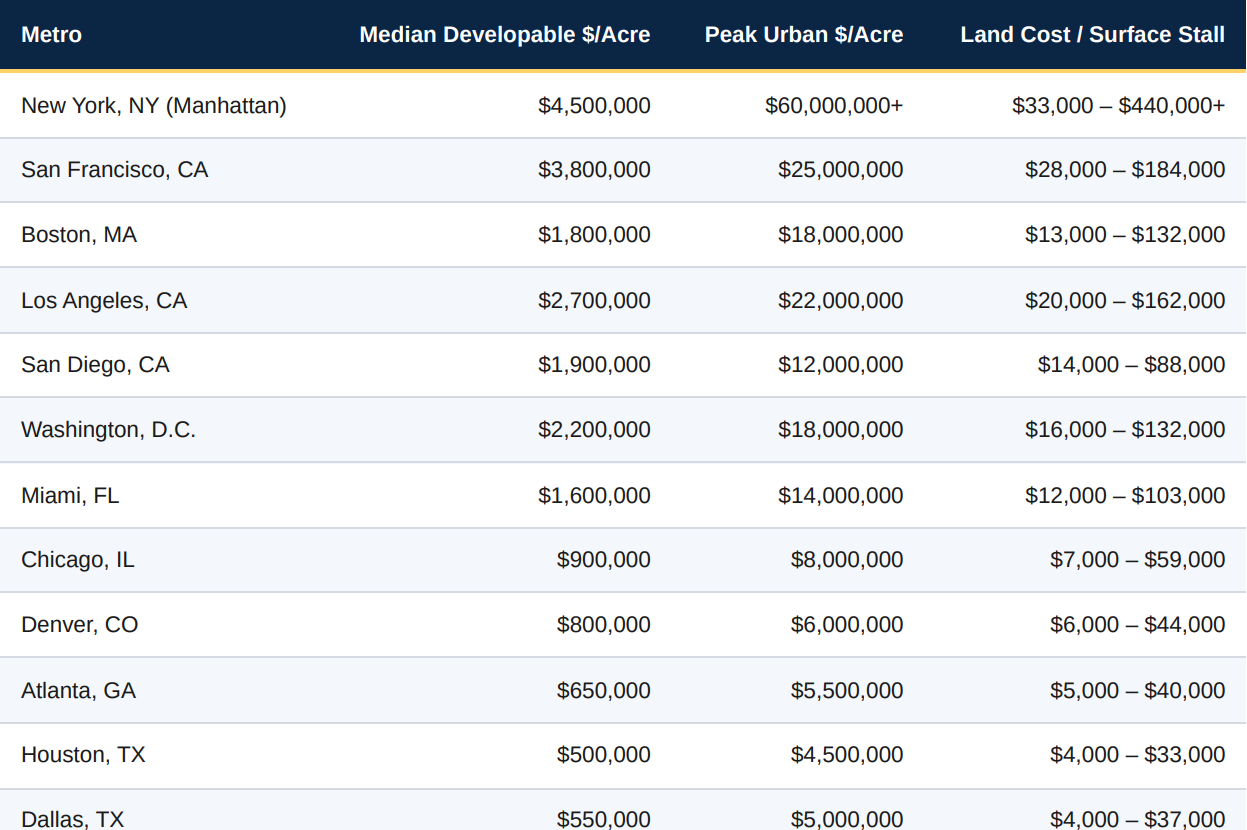
4.1 Urban Land Values, 2026
Recent Bloomberg / Lincoln Institute analyses of U.S. metropolitan land values place the following representative per-acre figures on developable urban land (updated to 2026 dollars):
Table 4.1 — Representative developable urban land values, 2026
Sources: Federal Reserve residential land value series (Davis, updated 2025); Lincoln Institute of Land Policy; Bloomberg urban land value analysis; author’s synthesis. Land-cost-per-stall assumes 320 SF/space allocation for surface configurations. Peak figures reflect prime submarkets.
4.2 The Opportunity Cost Calculation
Consider a real-world scenario: a mixed-use developer in Los Angeles requires 60 parking spaces. Two options
are on the table:
Option A — Conventional above-grade garage: 60 spaces × 350 SF gross = 21,000 SF of building footprint
dedicated to parking, plus ramps and support.
Option B — Semi-automated puzzle parking system: 60 spaces in approximately 5,000 SF of floor area.
The difference — 16,000 SF of building floor area — can be converted to residential, retail, hotel, or office use.
At Los Angeles’ current mid-market rents of approximately $3.50 per SF per month for residential/retail, the re‐
claimed space generates:
Monthly: 16,000 SF × $3.50 = $56,000
Annual: $672,000
30-year cumulative (2% annual escalation): approximately $27.3 million in additional gross revenue
Even applying a conservative 40% operating expense ratio and 6% capitalization rate, the additional asset value created by choosing puzzle parking exceeds $11 million. That figure is not a construction saving — it is pure alpha unlocked by a parking-typology decision.
THE RULE OF THUMB
On any site where developable land exceeds approximately $1.5 million per acre — a threshold now crossed in virtually every U.S. metro over one million population — the land opportunity cost of surface or wide-foot print parking exceeds the construction cost premium of a vertical mechanical system. Below that threshold, the choice becomes site- and program-specific.
5. Vertical Alternatives: Car Stackers & Puzzle Parking Lifts
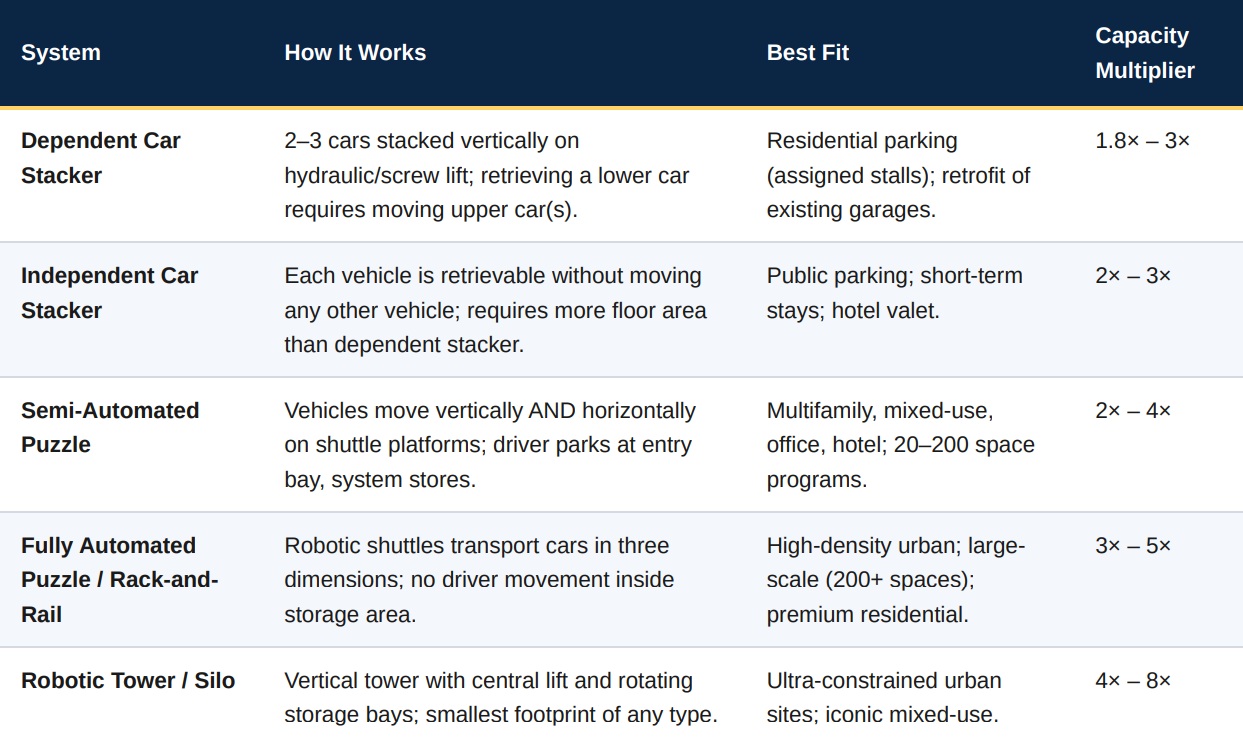
Mechanical parking is a family of technologies, not a single product. Understanding the taxonomy is essential for selecting the correct system for a given project scale, program, and site.
5.1 The Technology Taxonomy
Table 5.1 — Mechanical parking system taxonomy
5.2 Puzzle Parking Systems: The U.S. Sweet Spot
For most U.S. multifamily, mixed-use, hotel, and CRE projects in the 40 to 200-space range, semi-automated puzzle parking systems represent the optimal balance of capital cost, throughput, user experience, and municipal approvability. A typical semi-automated puzzle configuration provides:
Levels: −1 to +4 levels of vertical capacity (below-grade pit optional)
Retrieval time: 60 to 180 seconds per vehicle
User interface: Simple keypad or app-based call system
Ventilation: Minimal — vehicles are shut off during storage
Structural loads: Distributed loading; often lighter than conventional slab
Site geometry: Fits parcels as narrow as 20 feet wide
Because the system is engineered rather than constructed on-site, delivery schedules compress dramatically: installation is typically 8 to 20 weeks once the pad and enclosure are ready, compared with 9 to 14 months for a conventional above-grade structure of comparable capacity (The Automated Parking Company, 2026).
WHY “GOING VERTICAL” WINS
2× to 4× capacity in the same footprint — fewer square feet dedicated to cars means more square feet dedicated to revenue
Lower per-space equipment cost than a conventional garage in high-cost markets — $12,000–$22,000 installed vs. $32,000–$50,000+ conventional
Faster delivery — weeks not years, accelerating stabilization and improving IRR
No excavation required for many configurations — eliminates the underground cost curve entirely
Reduced operating expenses — lower lighting, HVAC, and staffing needs
Environmental advantages — smaller footprint, less concrete, minimal vehicle-fluid runoff
6. Total Cost of Ownership: A 30-Year Comparative Model
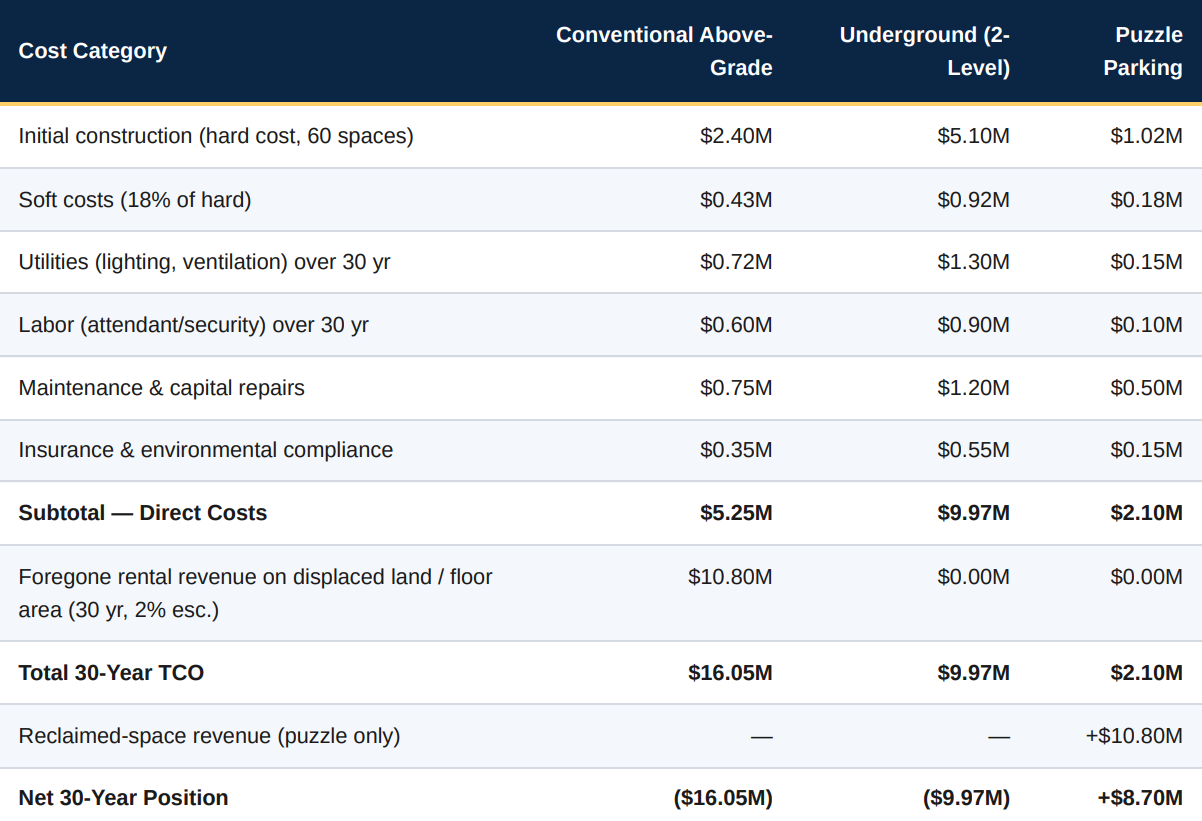
The strongest argument for vertical mechanical parking is not first-cost — though on a fully-loaded, per-space basis it usually wins there too — but total cost of ownership over the building’s operating life. This chapter walks through a rigorous 30-year TCO model for a representative 60-space facility.
6.1 Model Assumptions
The comparison below assumes a 60-space parking requirement in a mid-tier high-cost U.S. market (Los Angeles, Seattle, Boston, or comparable). The three options modeled are (A) a conventional above-grade concrete garage, (B) a two-level underground garage, and (C) a semi-automated puzzle parking system. All figures are in 2026 dollars, held constant for comparability; escalation is applied only where noted.
Table 6.1 — 30-year total cost of ownership, 60-space facility (in $ millions)
Direct-cost lines derived from WGI 2026 hard-cost benchmarks, IPMI 2025 operating-cost survey, and vendor maintenance contracts. Foregone rental revenue calculated at $3.00/SF/month across 15,000 SF of displaced floor area, 2% annual escalation. Source: Author’s synthesis, extended from The Automated Parking Company (2026) TCO framework.
The direction of the result is not sensitive to reasonable variation in the assumptions. Even in a market where reclaimed-space rents are only $1.50/SF/month, the puzzle-parking option still delivers a net advantage of approximately $3.5 million over 30 years compared with a conventional above-grade garage — and this before considering the accelerated stabilization value of a project delivered 6 to 12 months faster.
6.2 Why Conventional Garages Underperform Over Time
Conventional concrete parking structures have well-documented aging characteristics that don’t appear in first cost estimates:
Chloride attack on joints and rebar — particularly severe in salt-belt and coastal climates; drives most deck-failure repairs
Freeze-thaw damage — causes spalling and delamination in northern markets; repair typically runs $50–$120 per SF of affected area
Major structural repairs in years 15–25 — routinely $500,000 to $2M for a mid-sized garage
Stormwater compliance retrofits — as environmental regulations tighten, garages must add drainage/filtration
EV charging retrofits — cutting finished concrete to add conduit costs 3× to 5× what pre-installation would have cost
Mechanical systems, by contrast, are engineered products with predictable maintenance cycles and modular replacement pathways. Their aging curve is closer to that of an elevator system — well-understood, contractable, and budgetable.
A recently completed municipal parking structure in San Luis Obispo, California, opened at a total construction cost of approximately $43 million for 397 spaces — a per-space cost of $108,000 (The Automated Parking Company, 2026). Had the same 397-space program been delivered as a semi-automated puzzle parking system at $18,000 per space installed, the construction cost would have been approximately $7.14 million — a savings of $35.86 million, or 83%. Additionally, the puzzle system would have occupied approximately 40,000 SF of build‐ing footprint versus the 130,000+ SF the conventional structure required — freeing 90,000+ SF of buildable area for revenue-generating uses.
Completed in 2010, 200 Eleventh Avenue in the Chelsea district features a fully automated parking system that transports residents’ vehicles directly to their apartment level via an enclosed lift — a “sky garage.” The system allowed the developer to deliver a higher unit count on a constrained mid-block parcel while providing a premium amenity that supported significantly higher unit pricing. In dollar terms, industry analyses of the project estimate that the automated system saved approximately 18,000 square feet of below-grade excavation that would otherwise have been required for a conventional two-level underground garage — a hard-cost savings alone of roughly $4–6 million at 2010 dollars, and considerably more at 2026 replacement costs.
7.3 Boston Seaport Multifamily Retrofit
A mid-2020s multifamily project in Boston’s Seaport District — a market where soil conditions and coastal-resilience requirements push underground parking costs above $120,000 per space — used a dependent car stacker system to add 40 spaces within an existing above-grade garage footprint. The retrofit was completed in approximately 10 weeks and cost roughly $320,000 — a per-space delivered cost of $8,000. The equivalent capacity added via an underground addition would have exceeded $4.8 million and required 12+ months of construction, with resident disruption throughout.
7.4 Los Angeles Mixed-Use Small-Lot Redevelopment
A small-lot subdivision project in Los Angeles’ Silver Lake neighborhood used a semi-automated puzzle system to meet parking requirements on a 6,500-SF parcel — a site that could not have supported the required parking count via conventional means without eliminating the ground-floor commercial component. By choosing puzzle Parking Economics White Paper 7. Case Studies & Real-World Savings 26 TAP Calculator · parking, the developer preserved 2,400 SF of ground-floor retail, generating an estimated $96,000 in annual rent (or roughly $3.5 million over the 30-year hold at a 6% cap rate).
8. The Free Online Calculator: How to Use TAPCalculator
C O M P L E M E N TA R Y R E S O U R C E
TAP Calculator — Free Online Parking Cost Estimator
Model your project’s construction cost, land cost, and vertical-alternative savings in under five minutes. Available at tapculator.pages.dev
The TAPCalculator (tapculator.pages.dev) is a free online estimator tool designed to complement this white paper. It allows CRE investors, architects, developers, and municipal planners to translate the benchmark data presented here into a project-specific financial model in a matter of minutes.
8.1 What the Calculator Estimates
Parking construction cost — by parking typology (surface, above-grade, underground, puzzle/stacker), regionally adjusted to your city
Land cost — based on published metro land value benchmarks and your project’s parking-space count
Vertical-alternative savings — the delta in construction cost, land consumed, and 30-year TCO between a conventional garage and a puzzle parking or car stacker system
Reclaimed-space revenue potential — the estimated additional rentable area created by choosing a vertical mechanical system, and its capitalized value at market-standard cap rates
8.2 How to Use the Tool
Enter your city or metro. The calculator pulls the regional cost multipliers and land value benchmarks from the same datasets summarized in Chapter 3.
Enter your project’s required parking count. Whether driven by zoning, tenant demand, or program mix, the parking-space count is the primary driver of every downstream calculation.
Select the conventional baseline you’re evaluating against. Above-grade, underground (1-level, 2-level, 3-level+), or surface lot.
Review the vertical-alternative comparison. The calculator returns side-by-side construction cost, land consumed, delivery schedule, and 30-year TCO for both the conventional baseline and the recommended vertical alternative (puzzle parking or car stacker).
Adjust assumptions as needed. Cap rate, escalation, rental value per SF, and financing assumptions can all be tuned to match your underwriting standards.
Export or share your model. The calculator supports downloadable summary output for use in proformas, entitlement filings, or investment committee memoranda.
8.3 A Worked Example
To illustrate, consider a hypothetical developer planning a 120-unit mixed-use project in Boston’s Fenway neighborhood requiring 100 parking spaces:
Estimated savings: $2.4M in construction alone; 26,000 SF of reclaimed building area worth an estimated $2.9M in additional asset value; a 7-month acceleration in project stabilization
Total quantified advantage: Approximately $8M+ across the 30-year hold
TRY IT YOURSELF
Visit tapculator.pages.dev to model your own project. The tool is free to use, requires no registration, and reflects the same 2026 cost benchmarks synthesized in this white paper.
The single largest structural barrier to widespread U.S. adoption of vertical mechanical parking is not economic — the numbers, as established above, are decisive — but regulatory. Municipal zoning codes and building codes were written for an era in which mechanical parking did not meaningfully exist as a category, and many jurisdictions still treat it as an exotic or unregulated case, driving developers back toward the familiar conventional garage even when it is the worse choice.
9.1 Common Regulatory Barriers
Minimum stall dimensions written for driver-parked cars that do not apply to mechanical systems, but that reviewers apply anyway
Drive-aisle width requirements that mechanical systems by definition do not need
Ambiguous life-safety code for automated systems where no vehicles are being driven inside the storage area
Insufficient guidance for building department reviewers, leading to over-conservative interpretations
Financing barriers where lenders require conventional-parking appraisal comparables that don’t exist for mechanical alternatives
9.2 What Municipalities Should Do
City planning departments, zoning boards, and building departments have an opportunity to unlock significant private investment — and in many cases meaningful housing supply — with modest code updates:
Explicitly recognize mechanical parking in zoning code as a permitted method of meeting parking requirements, with published dimensional standards
Adopt IBC and NFPA provisions for automated parking (already in place in the model codes) rather than requiring case-by-case interpretations
Publish approval pathways and pre-approval frameworks for the most common puzzle and stacker system configurations
Reduce or eliminate minimum parking requirements in transit-served districts, allowing the market to right-size parking
Provide density bonuses or FAR incentives for projects using vertical mechanical parking, reflecting the land-efficiency public benefit
Update fire/life-safety inspection protocols to reflect that automated systems have no drivers or running engines in the storage area
9.3 The Housing Connection
The 2026 UCLA study by Schwartz makes the housing implications explicit: parking mandates now add $50,000 to $100,000 per housing unit in most large U.S. cities, and in some markets increase total project cost by more than 50%. Every housing unit that is not built because parking pushed the pro forma past feasibility is a policy choice — and every unit that is built at 30% higher cost because the developer had to accommodate a conventional structured garage passes that cost through to tenants and buyers.
Municipalities serious about housing affordability, sustainable urban form, or transit-oriented development should make vertical mechanical parking not just permitted but preferred. The land, capital, and operating savings quantified in this paper are also, in aggregate, the fiscal and social benefits available to any city willing to modernize its parking code.
10. Recommendations for CRE Investors, Architects, and Municipalities
10.1 For CRE Investors and Developers
Underwrite parking as an independent asset class within every project. On any deal where parking exceeds 8% of total capital budget, run the mechanical-alternative case in parallel with the conventional baseline.
Include foregone-revenue opportunity cost in every parking analysis. A pro forma that models only construction cost systematically overstates the case for conventional parking on any high-land-value site.
Use the TAP Calculator at feasibility stage to establish a quick baseline before hiring specialist consultants.
Engage vendors early. Puzzle and stacker system layouts influence structural design; involving the vendor at schematic design saves both money and time.
Negotiate maintenance contracts for the full hold period to lock in TCO predictability.
10.2 For Architects and Design Teams
Present the mechanical alternative in every project meeting where parking is discussed, even when the owner has not asked for it. Educating the client is part of the professional obligation.
Understand the technology. Every practice serving urban infill work should have at least one project completed or in design using a puzzle or stacker system.
Coordinate mechanical parking with life-safety and structural design from Day One. Late-stage introduction rarely goes well.
Document the land-efficiency benefit in narrative form for entitlement submittals — municipal reviewers respond to quantified public benefit.
10.3 For City Municipalities
Adopt clear code provisions for mechanical parking to eliminate case-by-case ambiguity.
Right-size or eliminate minimum parking requirements in transit-served districts.
Offer density bonuses for projects using vertical mechanical parking to reflect their public-benefit landefficiency contribution.
Publish approved-vendor lists and pre-reviewed configurations to accelerate permit review.
Update inspection and life-safety protocols to reflect the reality of automated systems.
Consider public-sector deployment. Municipal parking authorities are ideal candidates for puzzle systems on their own facilities — the same TCO logic that applies to private developers applies to public agencies
Parking is no longer a rounding error. In every U.S. metropolitan statistical area over one million residents — the 56 metros analyzed in this paper, home to roughly 60% of the American population — the fully-loaded delivered cost of a conventional parking space now exceeds the total per-unit construction cost of many building typologies that existed a generation ago. In the highest-cost markets, a single underground parking stall costs more than a decent used car, plus the annual median household income of the neighborhood it serves.
The data assembled in this white paper — drawn from WGI, RSMeans, UCLA, Rider Levett Bucknall, Terrapin Consulting Group, IPMI, and multiple manufacturer sources — points to a single, defensible conclusion: on virtually every parcel worth developing in a major U.S. metropolitan area, a vertical mechanical parking solution (car stacker or semi-automated puzzle parking system) will deliver a lower construction cost, a smaller building footprint, a faster construction schedule, a lower 30-year operating cost, and a substantially higher net asset position than a conventional above-grade or underground parking garage.
The gap between what the data supports and what the industry actually builds is a story of institutional inertia, regulatory unfamiliarity, and — most importantly — the absence, until recently, of accessible tools that translated aggregate cost data into project-specific numbers a decision-maker could act on. The TAPCalculator at tapculator.pages.dev is one such tool. This paper is another.
For CRE investors, the message is that parking is now one of the largest sources of alpha available in a fully priced real estate market. For architects, it is that mechanical parking is no longer a specialty item to be avoided but a mainstream tool to be mastered. For city municipalities, it is that a modest set of code updates and permitting reforms can unlock billions of dollars of private investment, meaningful housing supply, and a materially more sustainable urban form — without imposing any cost on the public balance sheet.
The vertical alternative is not experimental. It is not exotic. It is not more expensive. It is, in the 56 U.S. metros and dozens of global cities analyzed above, simply better. The only remaining question is which owners, designers, and municipalities move first — and which spend the next decade watching their competitors capture the savings.
Visit tapculator.pages.dev to run the numbers for your specific city, project size, and parking program. The tool is free, requires no registration, and reflects the same 2026 cost benchmarks as this paper.
References & Data Sources
1. WGI, Inc. (2026). 2026 Parking Structure Cost Outlook. West Palm Beach, FL. Available: https://publications.wginc.com/parking-cost-outlook-for-2026
2. WGI, Inc. (2025). 2025 Parking Structure Cost Outlook. West Palm Beach, FL.
3. International Parking & Mobility Institute (2026). WGI Releases 2026 Parking Structure Cost Outlook. https://www.parking-mobility.org/news/wgi-releases-2026-parking-structure-cost-outlook/
4. Schwartz, E. (2026). No Such Thing as Free Parking: Construction Costs in 17 U.S. Cities. UCLA Institute of Transportation Studies. https://its.ucla.edu/publication/no-such-thing-as-free-parking/
5. Terrapin Consulting Group (2026). Parking Garage Cost Per Space (2026): Above-Grade, Below-Grade, Pre-Cast vs Cast-in-Place vs PT. https://terrapincg.com/news/parking-garage-cost-per-space-2026
6. iRecruit (2026). Parking Garage Construction Cost: 2026 Benchmarks. https://www.irecruit.co/guides/parkinggarage-construction-cost
7. Smart Constructs (2026). Parking Garage Cost in 2026 | Full Cost Breakdown. https://smartconstructs.com/parkinggarage-cost/
8. Wins Parking (2026). Parking Lot Construction Cost Guide (2026). https://winsparking.com/parking-lot-constructioncost-guide
9. The Automated Parking Company (2026). Total Cost of Ownership Revealed: Why Puzzle Car Park Systems Beat Conventional Garages Over 30 Years. https://theautomatedparkingcompany.com/total-cost-of-ownership-revealedwhy-puzzle-car-park-systems-beat-conventional-garages-over-30-years/
10. ParkPlus (2026). Puzzle Parking or Car Stackers: How to Choose. https://parkplusinc.com/puzzle-parking-or-carstackers/
11. Robotic Parking Systems (2025). The Three Keys to Comparing Robotic Parking Systems vs. Conventional Ramp Garages. https://roboticparking.com/the-three-keys-to-comparing-robotic-parking-systems-vs-conventional-rampgarages/
12. Solid Parking (2025). Car Lift Price Guide 2025: Powerful, Smart & Cost-Saving Vertical Parking Systems.
13. Mutrade (2025). How Much Do Mechanized Parking Lots Cost? https://www.mutrade.com/news/how-much-domechanized-parking-lots-cost
14. DBSG (2025). This vs. That: Underground Parking Versus At-Grade Parking. https://www.dbsg.com/blog/surfaceparking-vs-underground-parking/
15. Watry Design (2024). The Top 10 Issues Affecting the Cost of Building a Parking Space. https://www.watrydesign.com/insights/top-10-issues-affecting-cost-of-building-a-parking-space
16. Charlesgate (2024). Puzzle Parking vs. Stack Parking For Residential Buildings. https://www.charlesgate.com/blog/puzzle-parking-vs-stack-parking
17. U.S. Census Bureau (2025). Metropolitan and Micropolitan Statistical Areas Population Totals: 2020–2024. https://www.census.gov/data/tables/time-series/demo/popest/2020s-total-metro-and-micro-statistical-areas.html
18. United Nations Department of Economic and Social Affairs (2025). The World’s Cities in 2025 · Data Booklet.
https://www.un.org/development/desa/pd/sites/www.un.org.development.desa.pd/files/undesa_pd_2025_databooklet_world_cities_in_2025.pdf
19. World Population Review (2026). Largest Cities by Population 2026. https://worldpopulationreview.com/cities
20. CoStar (2025). Paved Paradise: Here’s Where It Costs the Most to Park Money. https://www.costar.com/article/123635722/paved-paradise-heres-where-it-costs-the-most-to-park-money
21. Bloomberg (2017, updated 2023). America’s Urban Land Is Worth a Staggering Amount. https://www.bloomberg.com/news/articles/2017-11-02/america-s-urban-land-is-worth-a-staggering-amount
22. Davis, M. A. (2006, updated 2025). The Price of Residential Land in Large U.S. Cities. Federal Reserve Board. https://www.federalreserve.gov/pubs/feds/2006/200625/200625pap.pdf
23. Planetizen (2025). Comprehensive Parking Supply, Cost, and Price Analysis. https://www.planetizen.com/news/2025/01/133832-comprehensive-parking-supply-cost-and-price-analysis
24. Parking Reform Network (2025). Parking Lot Map. https://parkingreform.org/resources/parking-lot-map/
25. TAP Calculator (2026). Free online parking cost estimator. https://tapculator.pages.dev/
Per-space cost figures throughout this paper reflect a synthesis of the following primary sources: WGI’s 20th annual Parking Structure Cost Outlook (2026); RSMeans 2026 construction cost database, normalized via Engineering News-Record (ENR) Building Cost Index and RSMeans location factors; the UCLA / Rider Levett Bucknall 17-city construction cost analysis (Schwartz, 2026); Terrapin Consulting Group’s 2026 regional benchmark database; and manufacturer-provided pricing from more than a dozen automated-parking vendors active in the U.S. market.
Where sources reported ranges, midpoint values were used in city-level tables; where sources disagreed, the more recent and larger-sample source was preferred. All figures are expressed as 2026 U.S. dollars unless otherwise noted. Global comparator pricing (Table 3.3) was converted from local currency at September 2026 exchange rates and should be treated as directional rather than transaction-grade.
A.2 Limitations
This white paper is intended as an educational and planning resource. It does not constitute investment advice, engineering guidance, or a commitment to specific pricing on any project. Actual project costs will depend on site conditions, structural system, seismic and geotechnical requirements, local labor and material markets, permitting timelines, financing terms, and specifications not captured in aggregate benchmarks. Any decision-maker relying on the figures herein should engage qualified structural engineers, cost estimators, and parking-system specialists to validate assumptions against the specific project’s parameters.
A.3 About This White Paper
This document was prepared in September 2026 as a companion piece to the TAP Calculator, a free online parking cost estimator available at tapculator.pages.dev. It is intended for CRE investors, architects, developers, and city municipal planning departments evaluating the true economics of urban parking construction and the alternative of vertical mechanical parking systems. Feedback, corrections, and additional data are welcome and will be incorporated into future editions.
End of White Paper — Total 56 U.S. Metropolitan Statistical Areas and 24 Global Comparator Cities Analyzed First Edition · September 2026 · tapculator.pages.dev
We value community input and address concerns for harmonious solutions.
Research & Innovation
Continuous research and innovation to improve green parking solutions.
Our Step By Step Process Towards Building Smart Yet Sustainable Parking
At TAPCO, our process ensures seamless delivery of efficient and sustainable parking tech tailored to your evolving project needs.
01
Discovery & Consultation:
Understand your needs, site constraints, and objectives.
02
Customized Design:
Create a tailored parking solution with eco-friendly integration.
03
Project Approval & Collaboration:
Obtain necessary approvals and work closely with your team.
04
Manufacturing & Quality Control:
Ensure the highest standards of quality.
05
Timely Delivery & Installation:
On-time setup with minimal disruptions.
06
Thorough Testing & Commissioning:
Rigorous performance checks and safety adherence.
07
Training & Support:
Comprehensive staff training and ongoing maintenance services.
08
Environmental Responsibility:
Implement eco-friendly practices and sustainability monitoring.
09
Client Satisfaction:
Prioritize your project with any number of our solutions.
Frequently Asked Questions
Q: Can TAPCO’s solutions be tailored to our specific needs?
A: Absolutely! At TAPCO, we understand that every project is unique. Our experienced team of designers and engineers will work closely with you to understand your specific requirements, site constraints, and objectives.
Q: How many levels can The Automated Parking Company design for the Puzzle parking system?
A: The Automated Parking Company has the capability to design systems with 2 to 7 levels, accommodating a varying number of parking spaces. Moreover, if your project calls for additional space optimization, we can even incorporate one or two subterranean levels, effectively increasing the total parking capacity.
Q: Are TAPCO’s parking systems safe and reliable?
A: Yes, safety is our top priority at TAPCO. We adhere to stringent industry safety standards and conduct rigorous testing and quality control measures at every stage of the manufacturing process.
Our car parking solutions are designed and built to ensure the safety of users, vehicles, and your property. We use high-quality materials and employ advanced technology to ensure the reliability and durability of our parking systems.
Improving Parking Convenience with Parking Stackers
When it comes to parking solutions, attended-oriented systems offer a blend of efficiency and convenience that cater to the needs and challenges of urban areas, particularly high-demand areas.
These multi-level car stacker solutions are a game-changer when it comes to parking, allowing the creation of multiple parking spaces within a single area.
TAPCO introduces a wide array of innovative attended-oriented parking systems designed to optimize space utilization as well as offer user-friendly parking practices.
These systems are intended to provide a seamless parking experience and enable attendants to efficiently manage parking procedures while ensuring the convenience and safety of the users. Here are the key benefits of using attended-oriented parking systems.
Optimal Space Utilisation
Our attended-oriented parking systems incorporate car lift storage systems make optimal use of the available space. Vertical stacking of vehicles with the vertical storage lift enables the system to increase the parking capacity within a limited area, hence coping with the increasing parking demands.
Organised vertical stacking
The attended-oriented parking allows vertical stacking of vehicles to utilize a vertical space effectively. This approach reduces the area required for parking, thereby contributing to a more organized and aesthetically pleasant-looking parking facility.
Convenience
The attended-oriented parking system offers ease of use for the attendant as well as the user. While the attendant can successfully navigate the car stacker lift and swiftly move vehicles into a nesting position with minimal effort, users need little to no guidance to park their vehicles safely.
Enhanced Security
Our attended-oriented car stacking system comes with advanced features to ensure the safety of parked vehicles. While users have peace of mind, property managers can also be content with the knowledge that the facility is secure.
Versatile stacked car parking
We offer a variety of car stacker lift solutions. From four post car storage lifts to no post solutions, our systems can be implemented indoors as well as outdoors and can be adapted for various project requirements or property layouts. TAPCO’s attended-oriented parking systems can be used in various environments, from commercial establishments to residential complexes.
Revolutionary Parking Solutions with Automated Lift Parking System
As the urban landscape continues to grow, the demand for efficient car parking solutions has become increasingly important. TAPCO introduces revolutionary semi-automated smart parking systems that are designed to optimise space utilization and streamline parking procedures for multi-family residential complexes and commercial facilities. Compared to the conventional car lift system, our multi level car parks are designed to redefine convenience and efficiency.
Here are some of the key features of our semi-automated car parking systems
Space Optimization
Optimal space utilization is a key focus of our multi-level car storing solutions. Our stack parking systems are designed to accommodate multiple levels, providing an impressive number of parking spaces within a compact footprint. We can design and integrate two to seven parking levels in a single structure and customize varying lengths, widths, and heights.
Seamless Automation
Our smart parking system incorporates advanced automation to simplify the parking process. Drivers can effortlessly park their vehicles with minimum guidance, thereby providing efficient utilization of time.
EV Capability
Given the increasing trend of electric vehicles, our parking solutions are also designed to embrace the future of mobility and Electric Vehicles. To cater to the ever-evolving automotive landscape, we also feature charging facilities for electric cars. We are the only vendor offering 7000# rated systems.
Convenience
We understand that parking can be a source of frustration for people, particularly when you cannot find a spot and have to drive around looking for space. Such layouts can be problematic for larger properties. However, with our Puzzle Parking system, this problem can be easily resolved, offering convenience to individuals and saving valuable time when parking or capturing your auto.
FAQ
Q: What is the difference between a fully automated and semi-automated smart parking system?
A: Semi-automated Puzzle solutions and fully automated AGV parking systems are considered automated parking and compress footprints giving you back valuable square footage.
In a semi-automated parking system, drivers can park and/or retrieve their own auto, so this system rids you of any demand for parking attendants therefore lowering your OpEx. Once the users vehicle is stowed within the system, the semi-automated Puzzle system can move the car up and down or left to right to find its nesting space.
On the other hand, in a fully-automated parking system, the driver pulls into a loading bay where they remove themselves and leave their auto, the system will then maneuver the auto and autonomously stow the users auto within the parking vault.
Q: What is the difference between mechanical lift systems and semi-automated Puzzle Parking systems?
A: In a mechanical stacker system, individuals must operate for it to move, or you must incorporate attendants to manage the parking and retrieval process.. The mechanical stacker parking system is usually a Double, Triple, or Quad Stacker that can raise the vehicle directly up on the platform so that more than one vehicle can be parked in a vertical stack. We strongly encourage trained personnel to operate these systems due to the manual processes of storing or retrieving autos in a vertical arrangement.
On the other hand, in a semi-automated system, there is no demand nor need for attendants or personnel to retrieve autos. Once the driver has parked their vehicle within the system, the semi-automated Puzzle system can intelligently move the car up and down or left to right.
Q: Which properties are semi-automated parking systems suitable for?
A: Our semi-automated parking systems are mostly suitable and used for commercial office and multi-family residential complexes.
Q: Can electric cars be charged in semi-automated parking systems?
A: Absolutely, our semi-automated smart parking systems are EV capable and feature charging facilities for electric vehicles. We offer Level II smart charging capabilities that allow you to bill the user pro-rata and also reduce the number of electrical meters therefore reducing your overall build costs when compared to competitive vendors.
Q: What are the maintenance requirements of semi-automated parking systems?
A: Maintenance and upkeep of the parking systems by The Automated Parking Company are easy as they are designed for minimal maintenance and durability. However, please note that regular checks and maintenance schedules help ensure optimal performance.
EV-Chargers Form
EV Chargers
You’re almost there
Fill in the details below to get our Spec Sheet, CAD, and Revit!